tech
NASA maps show Earth's brightest and darkest regions at night
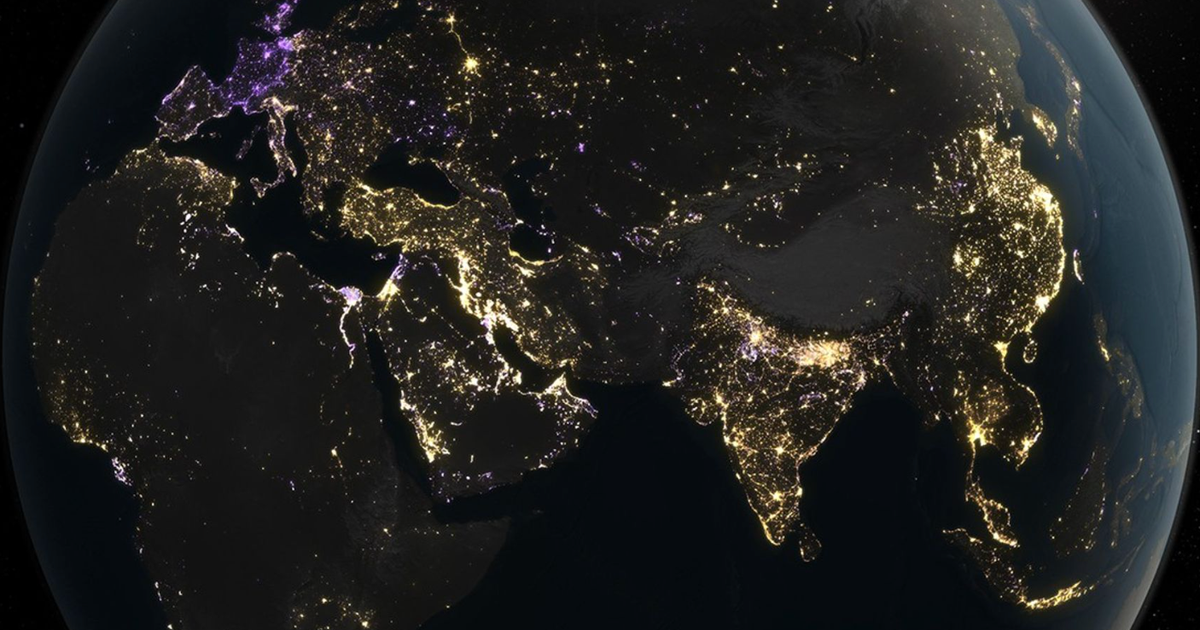
New maps from NASA using nearly a decade's worth of data show how the use of artificial light has shifted over the years.
TL;DR
- NASA analyzed nearly a decade of data (2014-2022) using its 'Black Marble' program to map artificial light at night.
- Contrary to expectations of gradual increase, researchers found 'much more nuanced patterns' of light radiance, including both brightening and dimming.
- Over the nine years, radiance increased by 34%, while dimming offset it by 18%, with both intensifying over the past decade.
- In the US, West Coast cities brightened due to population growth, while East Coast saw dimming attributed to energy-efficient bulbs and economic shifts.
- Globally, China and northern India saw brighter nights due to urban expansion, while Europe experienced dimming from energy conservation and a sharp drop in 2022 due to the energy crisis following the war in Ukraine.
- The findings show the human light footprint is a dynamic system, not universally expanding, with pervasive coexistence of brightening and dimming.